Documenting all the places
personal data goes.
MATERIALS
Health Data - all_health_data.zip
Mobile Apps Data - all_mobile_data.zip
DESCRIPTION
There are two datasets available for theDataMap Visualization Contest. The health data highlights data sharing arrangements of personal health information in the United States, while the mobile apps data documents which third parties popular mobile applications are sending user information to. The data found in these files presents information you can find here on theDataMap; you may look at the pages here to acquire more detailed information. Your team only needs to submit one visualization. You can choose one dataset to use, or you can combine data from both datasets.
Below are detailed descriptions of each dataset along with images of the current corresponding visualizations.
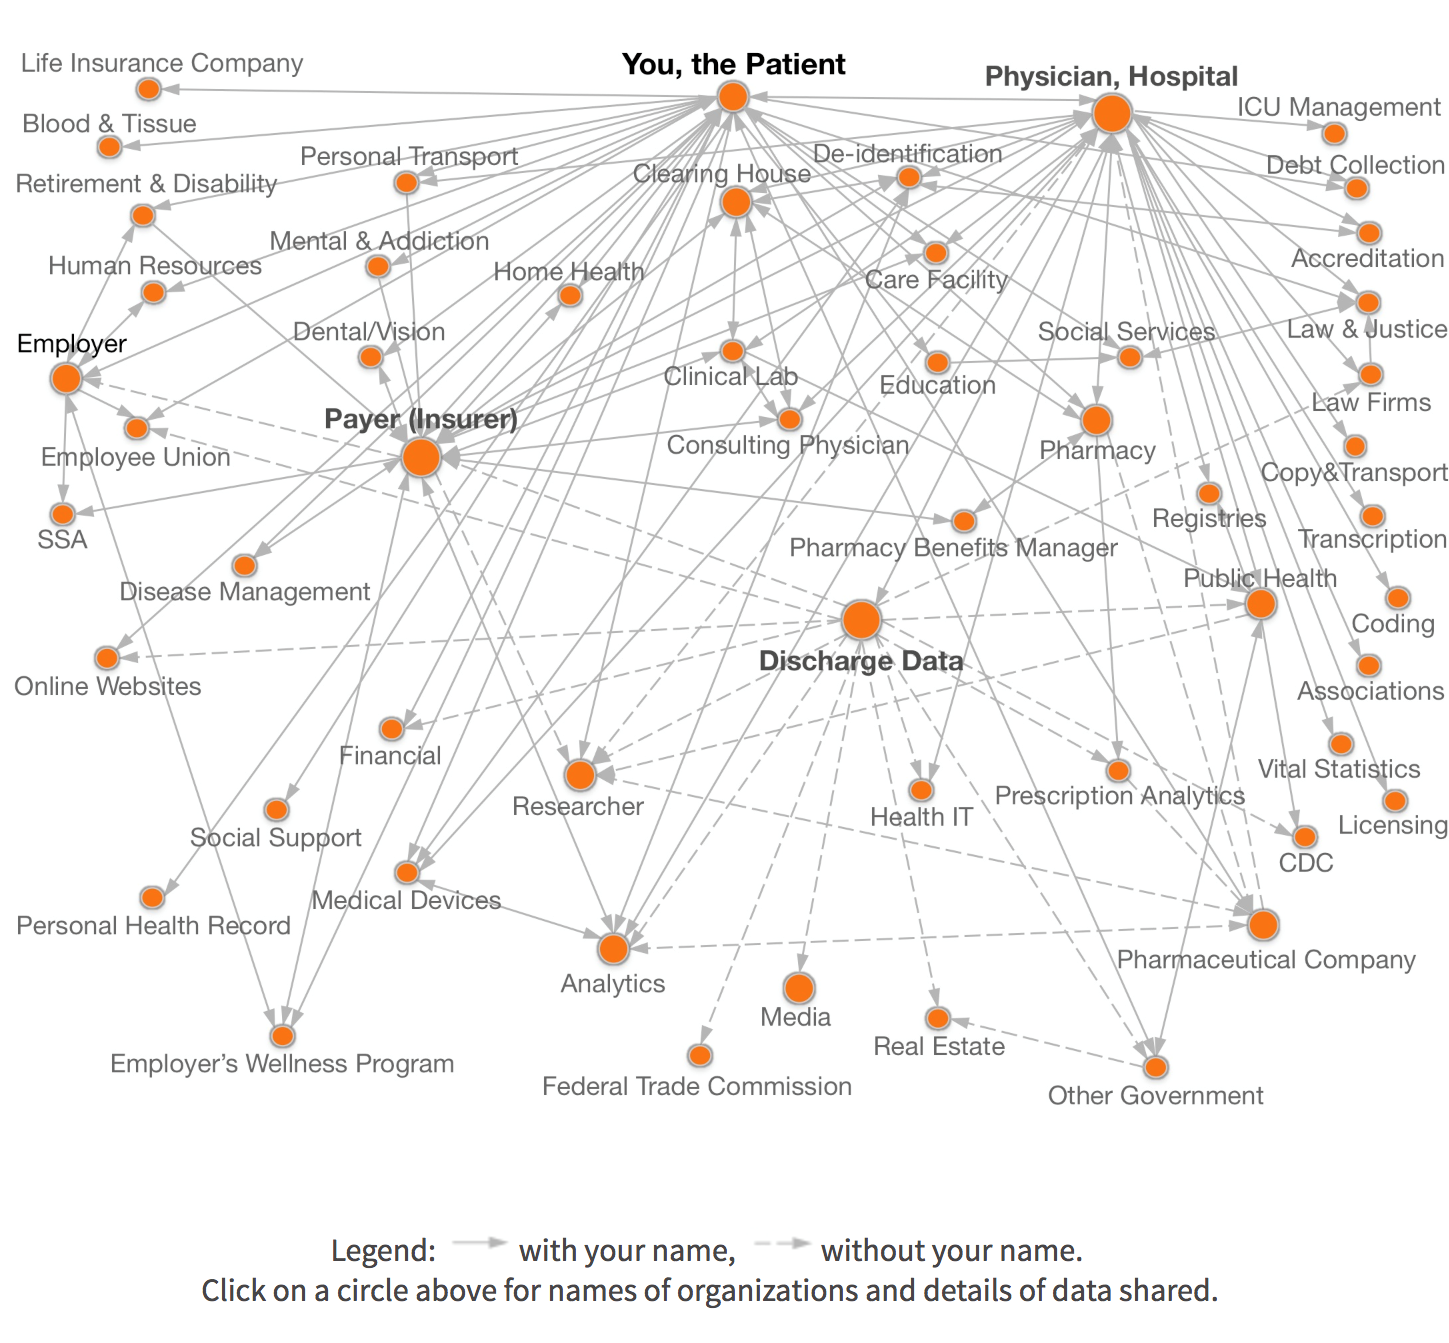
HEALTH DATA
Hospitals collect lots of information about patients. For a standard visit, names, addresses, phone numbers, and even social security numbers are processed through some electronic database.
This data does not always stay in the hospitals, however. Forty-eight states in the United States collect patient data statewide for legal and governmental use. The Health Information Portability and Accountability Act (HIPAA), established by the U.S. government, mandates that every state follows a strict set of rules and regulations to releasing personal health information to the public- all so that the identity of the patient is not fully disclosed.
There are a multitude of named organizations in the United States that participate in this sort of patient data sharing, the variety of which differs from state to state. Said data is also sometimes sold to certain buyers.
The health data is organized across 6 files. One file that lists the organizations (orgsindex), a list of categories that describe organizations (categories), an association of organizations and categories (catsorg), relevant information associated with each category (categories_info), examples of breaches associated with different categories and organizations (prcbreaches2005-18), and finally, a list of edges, or directions of data transfer, between categories (edges).
orgsindex.csv is a list of organizations and entities whose data sharing transaction(s) appear on theDataMap. The file has 5351 rows in total, not including the header row. The fields are as follows:
- OrgID - A unique identifier associated with the entity.
- Name - The name of the entity.
- SourceType - The type of source from which the name appeared.
categories.csv is a list of categories of data holders of health data. The file has 54 rows, not including the header row. These correspond to the nodes on the graph itself. The fields are:
- CatID - The unique identifier associated with a node on the graph.
- CatName - The name that appears for the node.
- Coordinates - The 4 pixel coordinates that locate the box associated with the node.
- Hover - The descriptive text that appears when the mouse hovers over the box associated with the node.
catsorgs.csv is an association list of categories (CatID) from the categories file and organizations (OrgID) from the OrgsIndex file. The file has 5336 rows, not including the header row. The fields are:
- Type - The kind of source that provided the information, such as "Discharge" or "Breaches".
categories_info.xlsx contains a longer description of each category that appears when a particular node, or category, on the graph is clicked. The file has 54 rows, not including the header row. The fields are:
- Category - The name of the cateogry for data holders of health data.
- URL - A link to the resulting webpage on thedatamap.org when the appropriate category/node on the current visualization is clicked.
- Information - The relevant descriptive text for each category that appears when the category is clicked.
prcbreaches2005-18.csv contains a list of breaches associated with different categories and organizations. The file has 4126 rows, not including the header row. The fields are:
- Records.Breached - The total number of records breached for some of the organizations.
- Records.Breached...Detail - The number of records breached with more details about the breaches.
- Name - The name of the organization.
- CatID - The category ID used in the other data files.
- Total.Records - The total number of breaches for all of the organzations (more information than Records.Breached).
- Region - The region that the organization is located in.
- Contact..etc. - The contact information for the organization.
- Category_dm - The name of the category associated with the CatID.
- Entity_prc - The type of organization.
- State - The state that the organization is located in.
- OrgID - The Organization ID.
- Location - The city that the organization is located in.
- Date.Made.Public - The date that the breaches were made public.
- Year - The year that the breaches were made public.
- Source.of.Breach.Notification - The source that publicized the breaches.
- Type - The type of breach.
- Description - The description of the breach.
- Example (HTML) - The HTML code used to generate the list of examples for each category in the health visualization.
edges.xlsx contains paths/directions of data transfer from one category to another in order to form the edges seen on the current visualization for the health data. The file has 169 rows, not including the header row. The fields are:
- FromCatID - the starting point of the edge.
- ToCatID - The ending point of the edge.
- NoName - This indicates whether or not the data is shared with your name, and an entry of "1" represents no name. As seen in the existing visualization images below, an edge without a name is dotted while an edge with a name is solid.
Below are the images rendered for the current visualization of health data on theDataMap, and examples of the existing features.
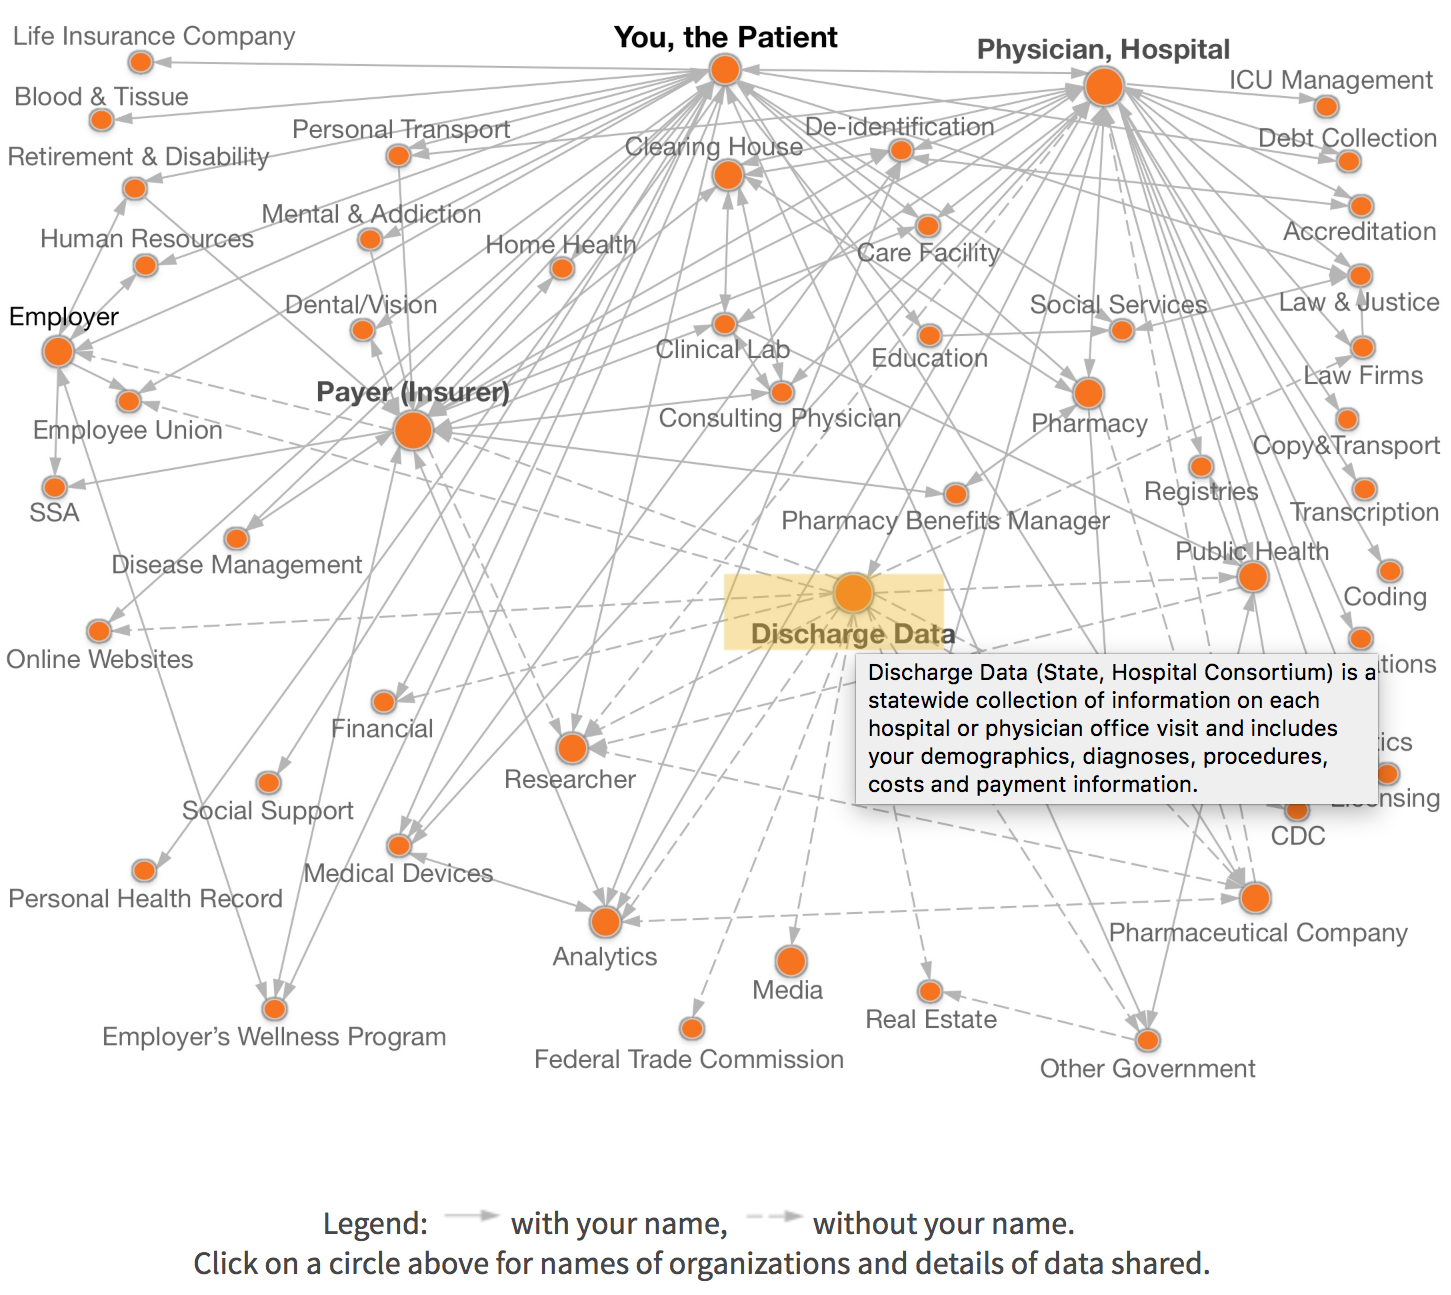
Hovering over a node gives a popup description of the category, which can be found in the Hover field in categories.csv. See below.
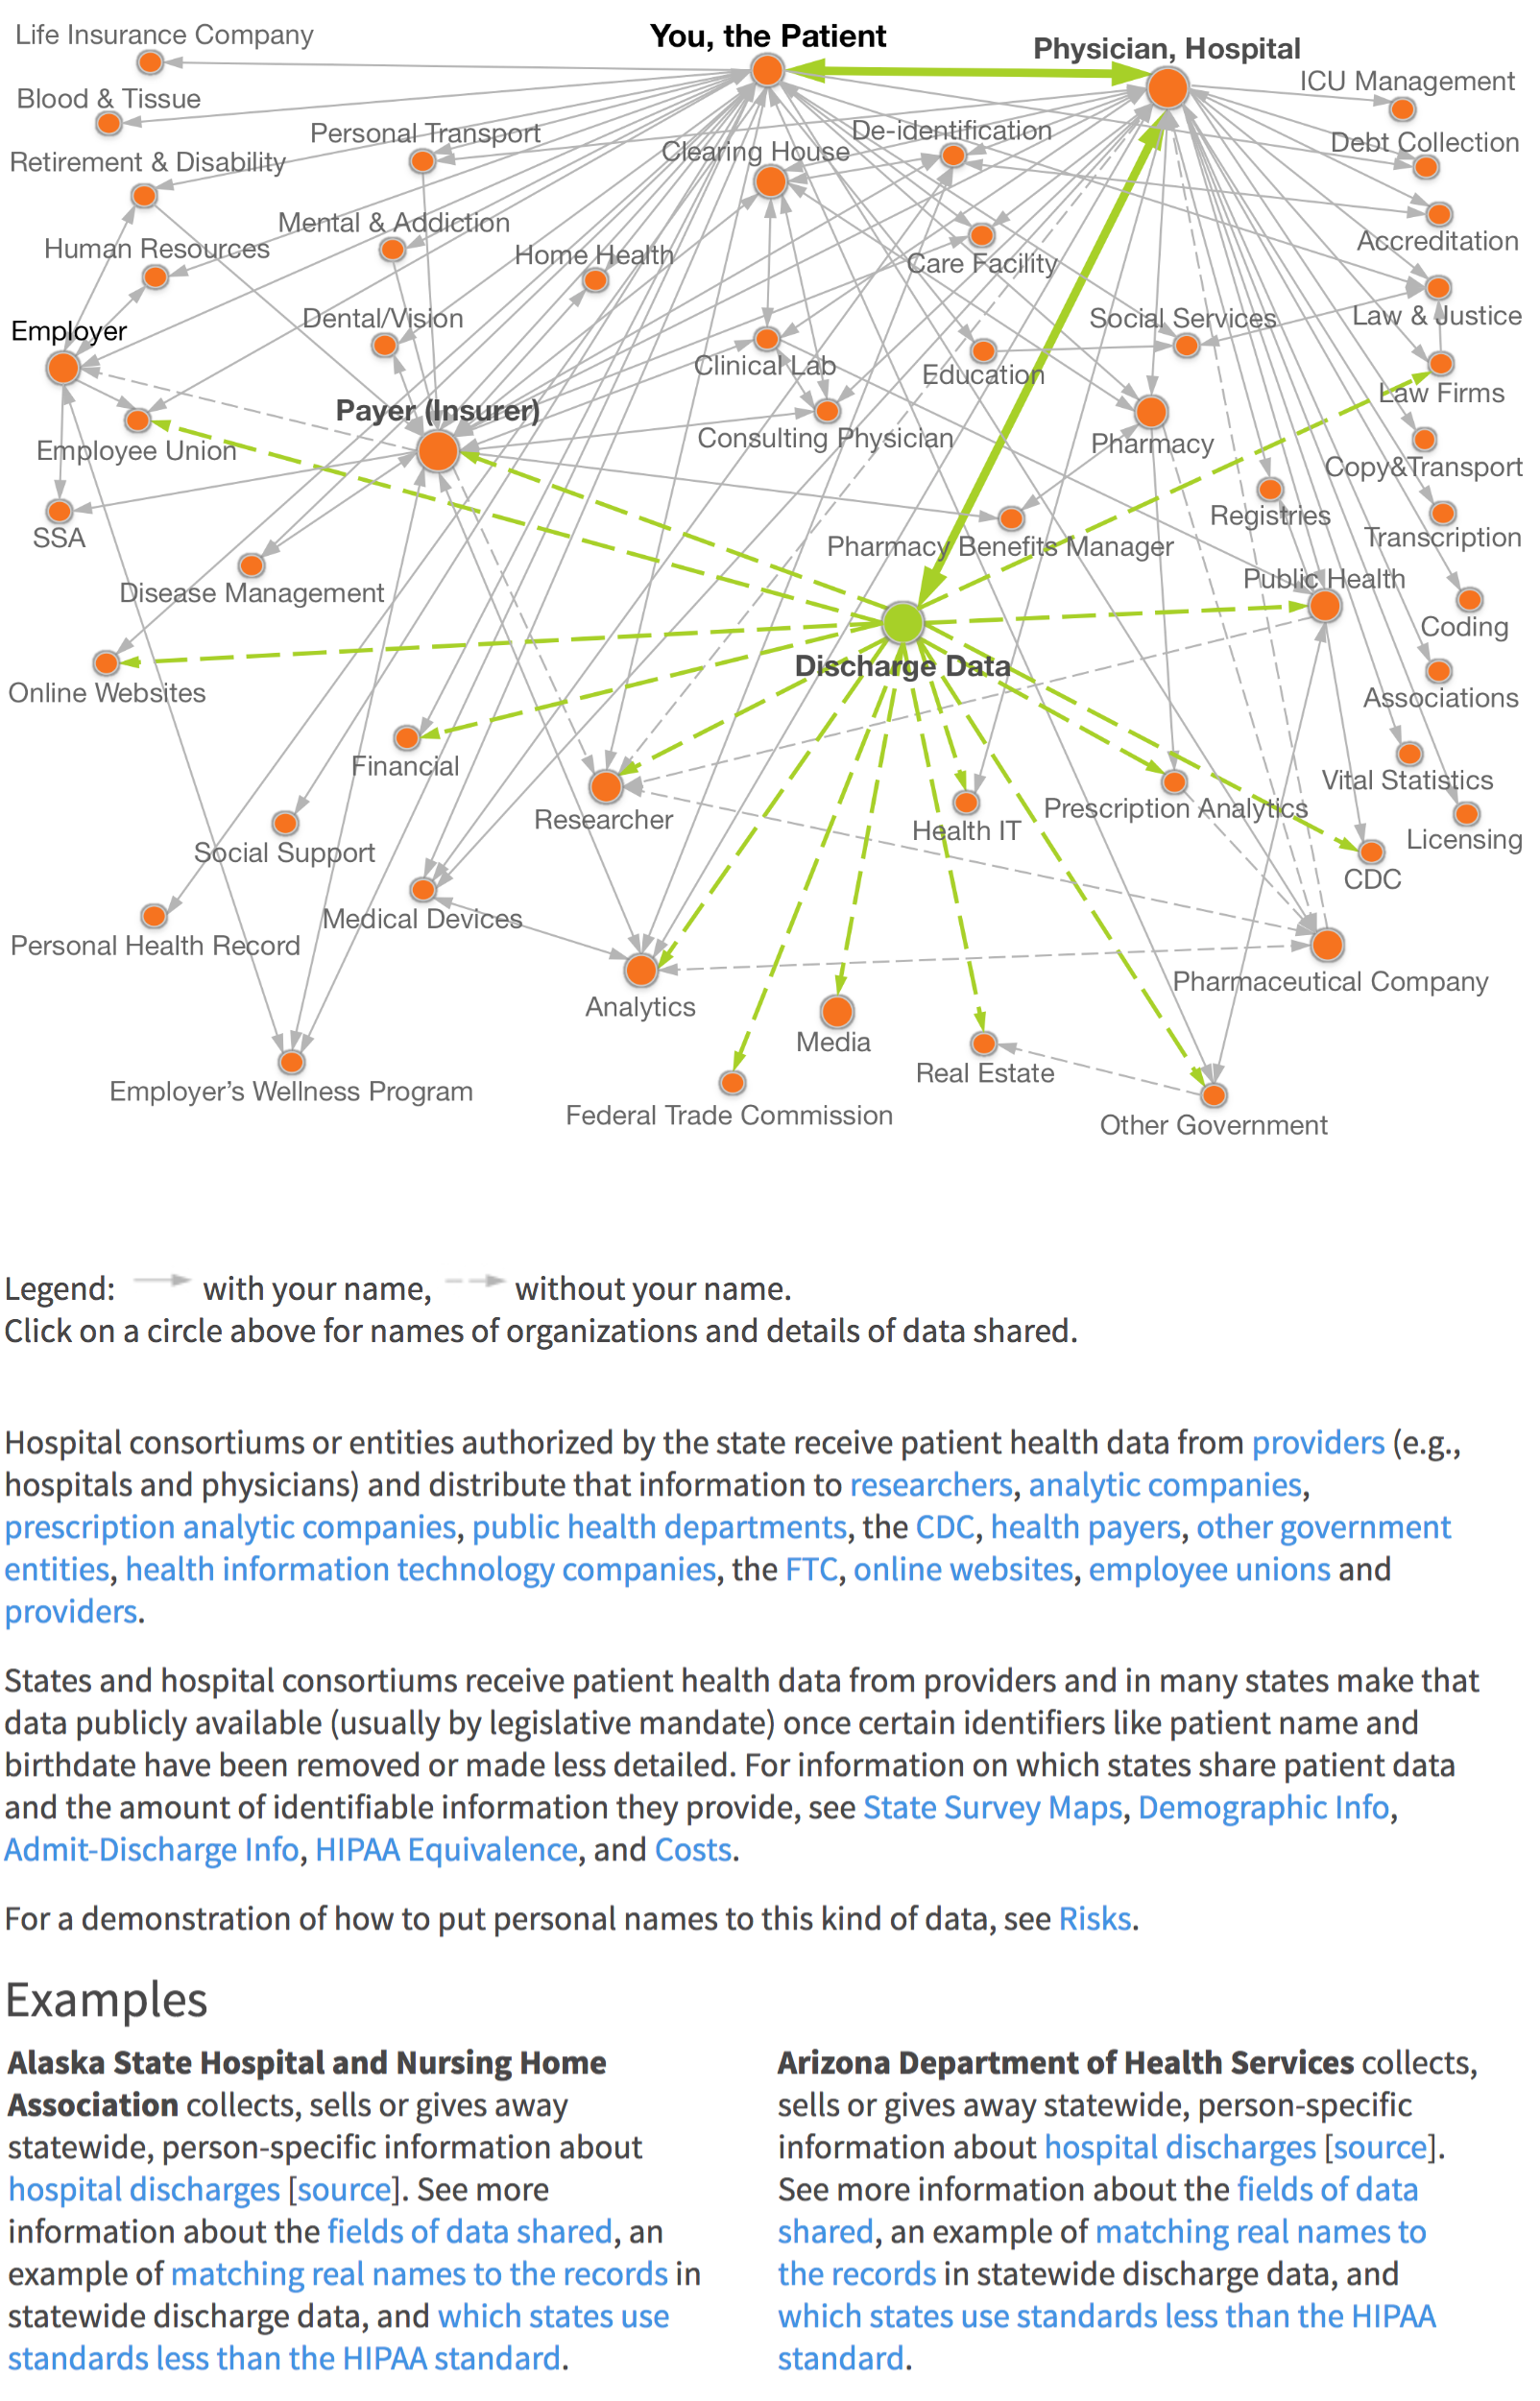
Clicking on a node shows a list of organizations documented as sharing data on one of the edges incident to the node. Below the image, an additional description of the category is loaded, which can be found in the Information field of categories_info.xlsx. Below this are examples of breaches, which can be generated using the Example (HTML) field from prcbreaches2005-18.csv. See below.
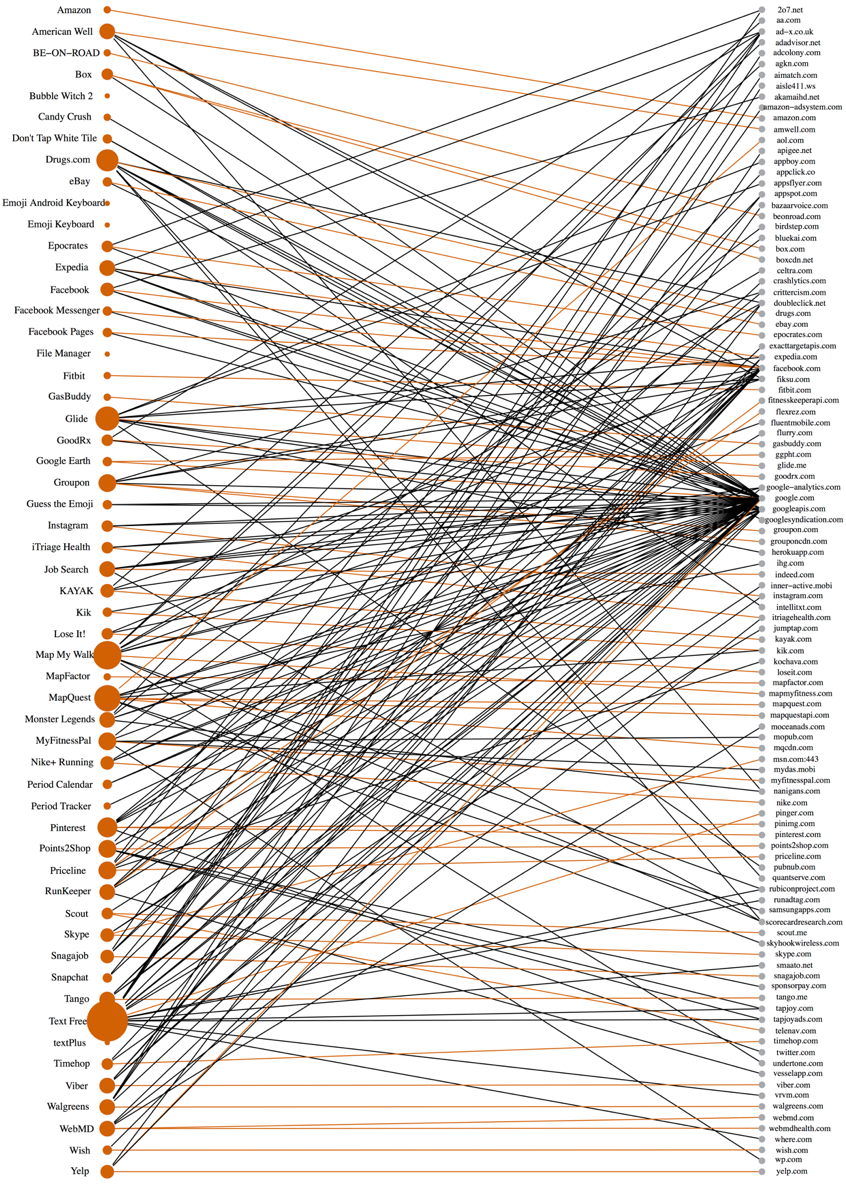
MOBILE APPS DATA
The mobile apps data is organized across 2 files, each containing 2 sheets. These data were collected from a study that surveyed 110 popular apps and documented which domains the apps were sharing user information with. One file lists the results for the Android apps that were studied (20160614_android_apps), while the other file lists the results for the iOS apps (20160614_ios_apps).
20160614_android_apps.xlsx contains two sheets, android_canaries and android_third_party_designation.
- android_canaries has 38,312 rows, not including the header row. It contains these fields:
- Flow ID is a unique ID number given to each entry in the dataset.
- App is the name of the Android app that is being studied.
- AppCategory is the specific category that the application falls under.
- Category is a broader categorization for the Android app.
- Domain lists the domain that the app is sharing information with.
- Third_party indicates whether or not the domain is a third party with either an entry of "Yes" or a blank cell.
- App_HOST lists the host of the application.
- HOST1, HOST2, HOST3, HOST4, and HOST5 can be ignored.
- android_third_party_designation has 258 rows, not including the header. The sheet contains these fields:
- App_HOST lists the host for the app.
- App is the name of the specific Android app.
- Domain is the domain that information is being sent to by the app.
- Third_party indicates whether or not the domain is a third party with either an entry of "Yes" or a blank cell.
20160614_ios_apps.xlsx contains two sheets, apple_canaries and apple_third_party_designation.
- apple_canaries contains all of the same fields as android_canaries, but the data contains entries for iOS apps rather than Android apps. The sheet has 32,079 rows, not including the header row.
- apple_third_party_designation contains all of the same fields as android_third_party_designation, but with entries for iOS apps. The sheet has 177 rows, not including the header row.
Below is the image currently rendered for mobile app data on theDataMap. Apps (left) are connected to various domains (right). The color of the line indicates whether the domain is that of the primary maker (orange) of the app or of a third party (black). Apps with larger circles shared sensitive data with more domains, both primary and third-party.